

Area profile
Business Bay
Dubai
In the 12 months to 3 November 2026, the ready price per sq ft of the same home types rose 3.7% (Dubai +6.5%), and registered sales fell 53% to 5,673.
- Median ready pricePer sq ft
- AED 1,856
- Ready price, 1-year changeSame home types, n ≥ 5 · 100% of ready sales
- +3.7% Dubai +6.5%
- Ready price, 3-year changeSame home types, n ≥ 5 · 100% of ready sales
- +23.1% Dubai +31.4%
- Registered salesLast 12 months
- 5,673
Data to 3 November 2026
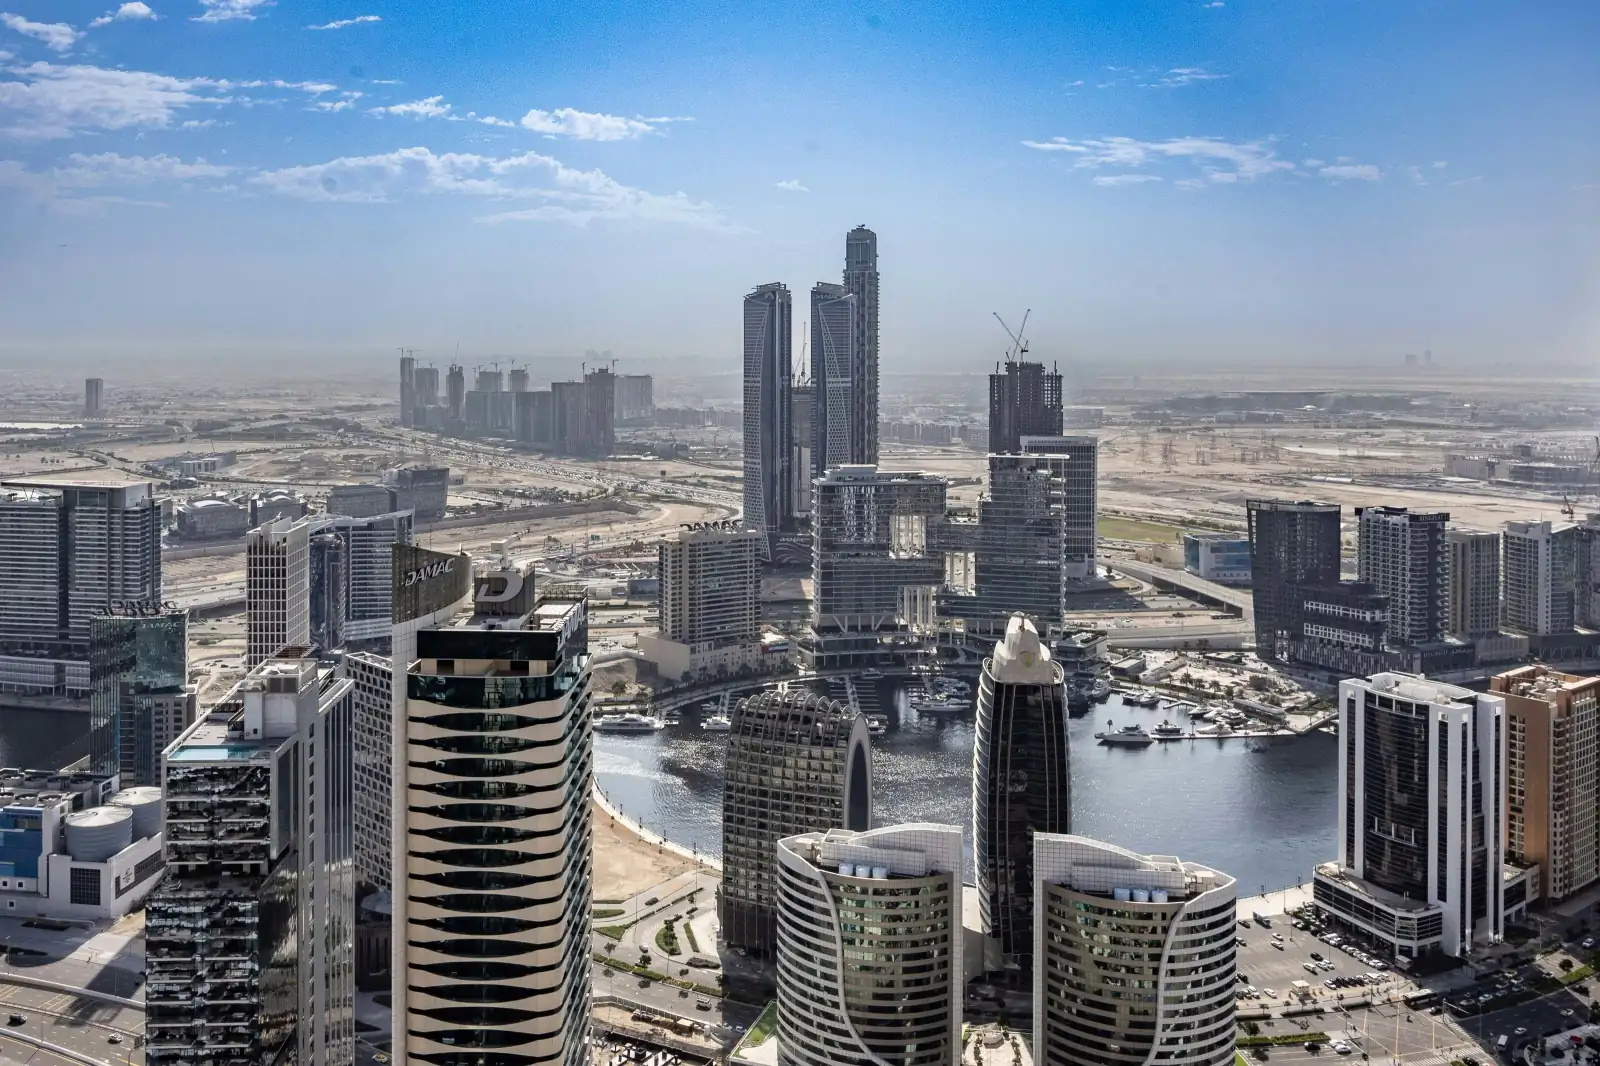
In the last 12 months, Dubai Land Department registered 5,673 sales in Business Bay, worth AED 17.2B in total. The number of sales was 53% lower than in the 12 months before. The median price was 2,708 AED/sqft off-plan and 1,856 AED/sqft for ready homes.
Source: Dubai Land Department open data, published on Dubai Data under the Dubai Data Open Data Licence: registered sales and new rent contracts. Medians use at least 5 transactions. Asking prices are aggregates of property portal listings.
Prices, over time.
Median registered price, AED per sq ft
- Ready (registered sales)
- Off-plan (registered sales)
Show the figures
| Month | Ready (registered sales) | Off-plan (registered sales) |
|---|---|---|
| Nov 2023 | 1,655 AED/sqft 301 sales | 2,270 AED/sqft 475 sales |
| Dec 2023 | 1,919 AED/sqft 347 sales | 2,256 AED/sqft 525 sales |
| Jan 2024 | 2,038 AED/sqft 377 sales | 2,261 AED/sqft 553 sales |
| Feb 2024 | 1,735 AED/sqft 301 sales | 2,424 AED/sqft 410 sales |
| Mar 2024 | 1,874 AED/sqft 320 sales | 2,598 AED/sqft 435 sales |
| Apr 2024 | 1,623 AED/sqft 245 sales | 2,604 AED/sqft 382 sales |
| May 2024 | 1,631 AED/sqft 326 sales | 2,732 AED/sqft 634 sales |
| Jun 2024 | 1,729 AED/sqft 277 sales | 2,730 AED/sqft 778 sales |
| Jul 2024 | 1,641 AED/sqft 284 sales | 2,681 AED/sqft 777 sales |
| Aug 2024 | 1,746 AED/sqft 231 sales | 2,877 AED/sqft 349 sales |
| Sep 2024 | 1,727 AED/sqft 244 sales | 2,704 AED/sqft 374 sales |
| Oct 2024 | 1,924 AED/sqft 358 sales | 2,708 AED/sqft 588 sales |
| Nov 2024 | 1,787 AED/sqft 235 sales | 2,524 AED/sqft 435 sales |
| Dec 2024 | 1,742 AED/sqft 259 sales | 2,306 AED/sqft 1,015 sales |
| Jan 2025 | 1,712 AED/sqft 228 sales | 2,605 AED/sqft 395 sales |
| Feb 2025 | 1,781 AED/sqft 339 sales | 2,522 AED/sqft 395 sales |
| Mar 2025 | 1,936 AED/sqft 268 sales | 2,494 AED/sqft 704 sales |
| Apr 2025 | 1,592 AED/sqft 399 sales | 2,519 AED/sqft 623 sales |
| May 2025 | 1,794 AED/sqft 256 sales | 2,440 AED/sqft 594 sales |
| Jun 2025 | 1,710 AED/sqft 236 sales | 2,598 AED/sqft 560 sales |
| Jul 2025 | 1,786 AED/sqft 276 sales | 2,579 AED/sqft 996 sales |
| Aug 2025 | 1,810 AED/sqft 215 sales | 2,723 AED/sqft 1,290 sales |
| Sep 2025 | 1,782 AED/sqft 249 sales | 2,771 AED/sqft 1,086 sales |
| Oct 2025 | 1,939 AED/sqft 297 sales | 2,579 AED/sqft 688 sales |
| Nov 2025 | 1,886 AED/sqft 253 sales | 2,679 AED/sqft 602 sales |
| Dec 2025 | 1,914 AED/sqft 283 sales | 2,753 AED/sqft 670 sales |
| Jan 2026 | 1,860 AED/sqft 248 sales | 2,985 AED/sqft 516 sales |
| Feb 2026 | 2,008 AED/sqft 253 sales | 2,737 AED/sqft 288 sales |
| Mar 2026 | 1,941 AED/sqft 138 sales | 2,705 AED/sqft 277 sales |
| Apr 2026 | 1,838 AED/sqft 145 sales | 2,659 AED/sqft 203 sales |
| May 2026 | 1,780 AED/sqft 114 sales | 2,467 AED/sqft 105 sales |
| Jun 2026 | 1,805 AED/sqft 175 sales | 2,553 AED/sqft 169 sales |
| Jul 2026 | 1,845 AED/sqft 171 sales | 2,303 AED/sqft 120 sales |
| Aug 2026 | 1,867 AED/sqft 183 sales | 2,486 AED/sqft 120 sales |
| Sep 2026 | 1,753 AED/sqft 206 sales | 2,475 AED/sqft 115 sales |
| Oct 2026 | 1,834 AED/sqft 232 sales | 2,483 AED/sqft 94 sales |
Where the change in sales came from.
Registered sales in the last 12 months against the 12 months before, by DLD registration type, beside all of Dubai.
- Off-plan-63%Off-plan sales fell by 63%, from 8,809 to 3,256.Dubai: -9.9%
- Ready-26%Ready sales fell by 26%, from 3,265 to 2,417.Dubai: -27.8%
The projects whose number of sales moved most
- Binghatti Skyrise276 sales, against 3,005
- Bayz 102 By Danube131 sales, against 593
- Binghatti Aquarise453 sales, against 894
Counts of registered sales, not prices: a project’s count follows its launches and how many homes it has left to sell.
What does each home type look like?
Apartment · Studio
- Ready median price
- AED 1M
- Median yearly rent
- AED 65K
- Gross yield
- 6.5%
Apartment · 1 bed
- Ready median price
- AED 1.5M
- Median yearly rent
- AED 90K
- Gross yield
- 6.2%
Apartment · 2 beds
- Ready median price
- AED 2.3M
- Median yearly rent
- AED 135K
- Gross yield
- 6%
Apartment · 3 beds
- Ready median price
- AED 3.5M
- Median yearly rent
- AED 185K
- Gross yield
- 5.3%
Apartment · 4 beds
- Ready median price
- AED 5.5M
- Median yearly rent
- AED 300K
- Gross yield
- 5.5%
Apartment · 5 beds
- Ready median price
- —
- Median yearly rent
- —
- Gross yield
- —
Apartment · 6 beds
- Ready median price
- —
- Median yearly rent
- —
- Gross yield
- —
Last 12 months. Medians of at least 5 registered sales or new rent contracts; the median price of all sales mixes ready and off-plan. Gross yield is the median new yearly rent over the ready median price, shown where a home type has at least 10 ready sales and 5 new rents (“rent only” otherwise), before service charges and other costs.
- Median service charge
- 20.04 AED/sqftA year · median of 72 developments’ owners’ association budgets, 2026Apartment buildings’ budgets; villa and townhouse budgets are left out.
After service charges
Net yield, Apartment · 1 bed: 5.1% after the area’s median service charge (AED 20.04 per sq ft a year, 2026, budgets of 72 developments). Gross yield: 6.2%.
Net yield takes the service charge off the rent. It is still before vacancy, maintenance, agency and DLD fees and mortgage costs, and an owners’ association budget is not any one owner’s bill. How net yield is worked out
Net yield for every home type and every project is in the area reportOff-plan or ready.
Off-plan premium, same home type
Apartment · 1 bed: off-plan homes sold at 41.9% above ready ones per sq ft in the last 12 months (2,680 AED/sqft against 1,889 AED/sqft, medians of 1,520 and 1,023 sales).
Same home type, not the same buildings: off-plan stock is often newer, so the gap is not a forecast of resale prices. Not investment advice.
The middle half of prices
Middle half of Apartment · 1 bed · Off-plan sales: AED 2,381–2,994 per sq ft (AED 2,000,000–2,635,000), 1,520 sales in the last 12 months. The full spread by home type is in the area report.
A quarter of these sales were below the band and a quarter above it. Registered sales, not a valuation.
Off-plan to ready, around completion
For 23 of the 35 projects in this area completed between 2021 and 2025 (DLD project register), the median project’s ready price per sq ft in the 12 months after completion was 5.8% above its off-plan price per sq ft in the 12 months before.
Dubai’s price index rose by 8.2% over the same months (the median across these projects).
Dubai’s counted projects completed in those years, worked out the same way: 14.4% above.
This is history, not a forecast. These projects were completed in years when Dubai prices were rising, and the earliest windows start in the 2020–21 low. Only completed projects with at least 10 registered sales in each window count, and a project needs the full 12 months after completion first: one completed within the last 12 months is in the total but not yet counted. Projects not yet completed or cancelled are not included. DLD records do not separate a developer’s own sales from resales by earlier buyers, and the two windows cover different homes and unit mixes. The step and the index move are context for each other, not a difference to subtract: each is a median across the projects. Registered sale prices only, before fees, payment-plan terms, financing, service charges and rent: registered sales, not a valuation, and not investment advice.
Future supply
24,850
Homes under construction or planned, in 52 projects
- Finished43,406 homes110 projects
- Under construction20,732 homes39 projects
- Planned or on hold4,118 homes13 projects
- Pipeline per finished home
- 0.57×Low pipeline pressure compared with Dubai as a whole (1.17×)
- Homes due in the next 24 months
- 10,491Under construction or planned, with a DLD end date in that time
13 projects (5,227 homes) are past their DLD end date.
The project-by-project handover calendar is in the area reportFrom the DLD project register for this area, counting apartments and villas. Records still not finished more than 5 years after their DLD end date are left out as stale.
Ready turnover, last 12 months
5%
Ready sales in the last 12 months came to 5% of the 43,406 homes in the area’s finished DLD register projects (2,162 sales). Dubai: 7.2%.
Ready sales count resales and a developer’s sales of finished homes alike. Not counted, homes or sales: buildings older than the DLD project register, and villa projects whose sales DLD mostly registers as land. DLD data only.
Sales of AED 2M or more.
54.5%
54.5% of the area’s home sales in the last 12 months were for AED 2M or more (3,092 of 5,669). Dubai: 33%.
AED 2M is the minimum total property value for the UAE’s 10-year Golden Residence (golden visa) for real-estate investors, according to ICP and GDRFA Dubai (rules checked on 5 November 2026). This count shows registered sale prices only; the authorities decide each application on their own conditions, such as the owner’s share, how the value is certified and how the home is financed.
- ICP: UAE Golden Residency, conditions for real-estate investors
- GDRFA Dubai: golden residence permit for investors
Home sales of the last 12 months, every home type together. The area report has every price band, by home type.
Projects in Business Bay
Browse all projects- Binghatti Skyrise3,281 sales in 24 monthsView project
- Binghatti Aquarise1,347 sales in 24 monthsView project
- Al Habtoor Tower779 sales in 24 monthsView project
- Bayz 102 By Danube724 sales in 24 monthsView project
- Binghatti Skyhall648 sales in 24 monthsView project
- One by Binghatti584 sales in 24 monthsView project
- Downtown Residences401 sales in 24 monthsView project
- Peninsula Four328 sales in 24 monthsView project
The latest registered sales.
| Date | Project | Unit | Size | Price | AED/sqft |
|---|---|---|---|---|---|
| 3 Nov 2026 | Vela by Omniyat | Apartment · 3 beds · Off-plan | 6,361 sqft | AED 38,997,126 | 6,131 |
| 3 Nov 2026 | The Opus by Omniyat | Apartment · 1 bed · Ready | 1,399 sqft | AED 3,250,000 | 2,323 |
| 3 Nov 2026 | Binghatti AquariseTower C | Apartment · 2 beds · Off-plan | 1,301 sqft | AED 3,099,999 | 2,383 |
| 3 Nov 2026 | J OneJ One - 1 | Apartment · 2 beds · Ready | 1,593 sqft | AED 2,800,000 | 1,758 |
| 3 Nov 2026 | Bayz 102 By Danube | Apartment · 1 bed · Off-plan | 749 sqft | AED 2,625,000 | 3,505 |
| 3 Nov 2026 | Bayz 102 By Danube | Apartment · 1 bed · Off-plan | 749 sqft | AED 2,601,000 | 3,473 |
| 3 Nov 2026 | Sol Bay | Apartment · 2 beds · Ready | 1,478 sqft | AED 2,450,000 | 1,658 |
| 3 Nov 2026 | DAMAC Towers by ParamountB) | Apartment · 2 beds · Ready | 1,407 sqft | AED 2,175,000 | 1,546 |
| 3 Nov 2026 | Binghatti SkyriseTower C | Apartment · Studio · Off-plan | 466 sqft | AED 1,424,999 | 3,058 |
| 3 Nov 2026 | Aykon City 2Tower C | Apartment · 2 beds · Ready | 817 sqft | AED 1,200,000 | 1,469 |
3 Nov 2026
Apartment3 bedsOff-plan6,361 sqft
AED 38,997,1266,131 AED/sqft
3 Nov 2026
Apartment1 bedReady1,399 sqft
AED 3,250,0002,323 AED/sqft
3 Nov 2026
Apartment2 bedsOff-plan1,301 sqft
Tower CAED 3,099,9992,383 AED/sqft
3 Nov 2026
Apartment2 bedsReady1,593 sqft
J One - 1AED 2,800,0001,758 AED/sqft
3 Nov 2026
Apartment1 bedOff-plan749 sqft
AED 2,625,0003,505 AED/sqft
3 Nov 2026
Apartment1 bedOff-plan749 sqft
AED 2,601,0003,473 AED/sqft
3 Nov 2026
Apartment2 bedsReady1,478 sqft
AED 2,450,0001,658 AED/sqft
3 Nov 2026
Apartment2 bedsReady1,407 sqft
B)AED 2,175,0001,546 AED/sqft
3 Nov 2026
ApartmentStudioOff-plan466 sqft
Tower CAED 1,424,9993,058 AED/sqft
3 Nov 2026
Apartment2 bedsReady817 sqft
Tower CAED 1,200,0001,469 AED/sqft
Asking prices against sales
- Property portal asking prices29.4%above registered sale pricesMedian gap across 10 segments
Property portal asking prices are compared with registered sales per segment (same market, property type and bedrooms), only where there are at least 10 listings and 10 sales. No individual listing is shown.
Questions about Business Bay
What is the price per sq ft in Business Bay?
In the 12 months to 3 November 2026, the median registered sale price was 1,856 AED/sqft for ready homes and 2,708 AED/sqft off-plan. The two medians mix different home types.
How did prices and sales in Business Bay change over the last year?
In the 12 months to 3 November 2026, the ready price per sq ft of the same home types rose 3.7% (Dubai +6.5%), and registered sales fell 53% to 5,673.
What is the rental yield in Business Bay?
Net yield, Apartment · 1 bed: 5.1% after the area’s median service charge (AED 20.04 per sq ft a year, 2026, budgets of 72 developments). Gross yield: 6.2%. Rents and prices from the 12 months to 3 November 2026. Net yield takes the service charge off the rent. It is still before vacancy, maintenance, agency and DLD fees and mortgage costs, and an owners’ association budget is not any one owner’s bill.
What are the service charges in Business Bay?
The area’s median service charge in 2026 is AED 20.04 per sq ft a year, across the owners’ association budgets of 72 developments. Apartment buildings’ budgets; villa and townhouse budgets are left out.
How many homes are under construction or planned in Business Bay?
As of 3 November 2026, the DLD project register lists 24,850 homes under construction or planned in Business Bay, 10,491 of them in projects with a DLD end date in the next 24 months. An end date is the date in the DLD register, not a handover forecast.
Where do these figures come from?
From Dubai Land Department open data, published on Dubai Data, to 3 November 2026: registered sales, new rent contracts and the project register. They are registered sales, not a valuation, and not investment advice.
To buy or rent
Looking to buy or rent in Business Bay?
Leave your details and partner agents who work in Business Bay can send you homes for sale or rent that match what you are looking for.
Own a unit in Business Bay? See what it is worth on My Unit Worth