

Dubai property, in focus
Explore Dubai areas.
Registered sales, price trends and the record behind every building.
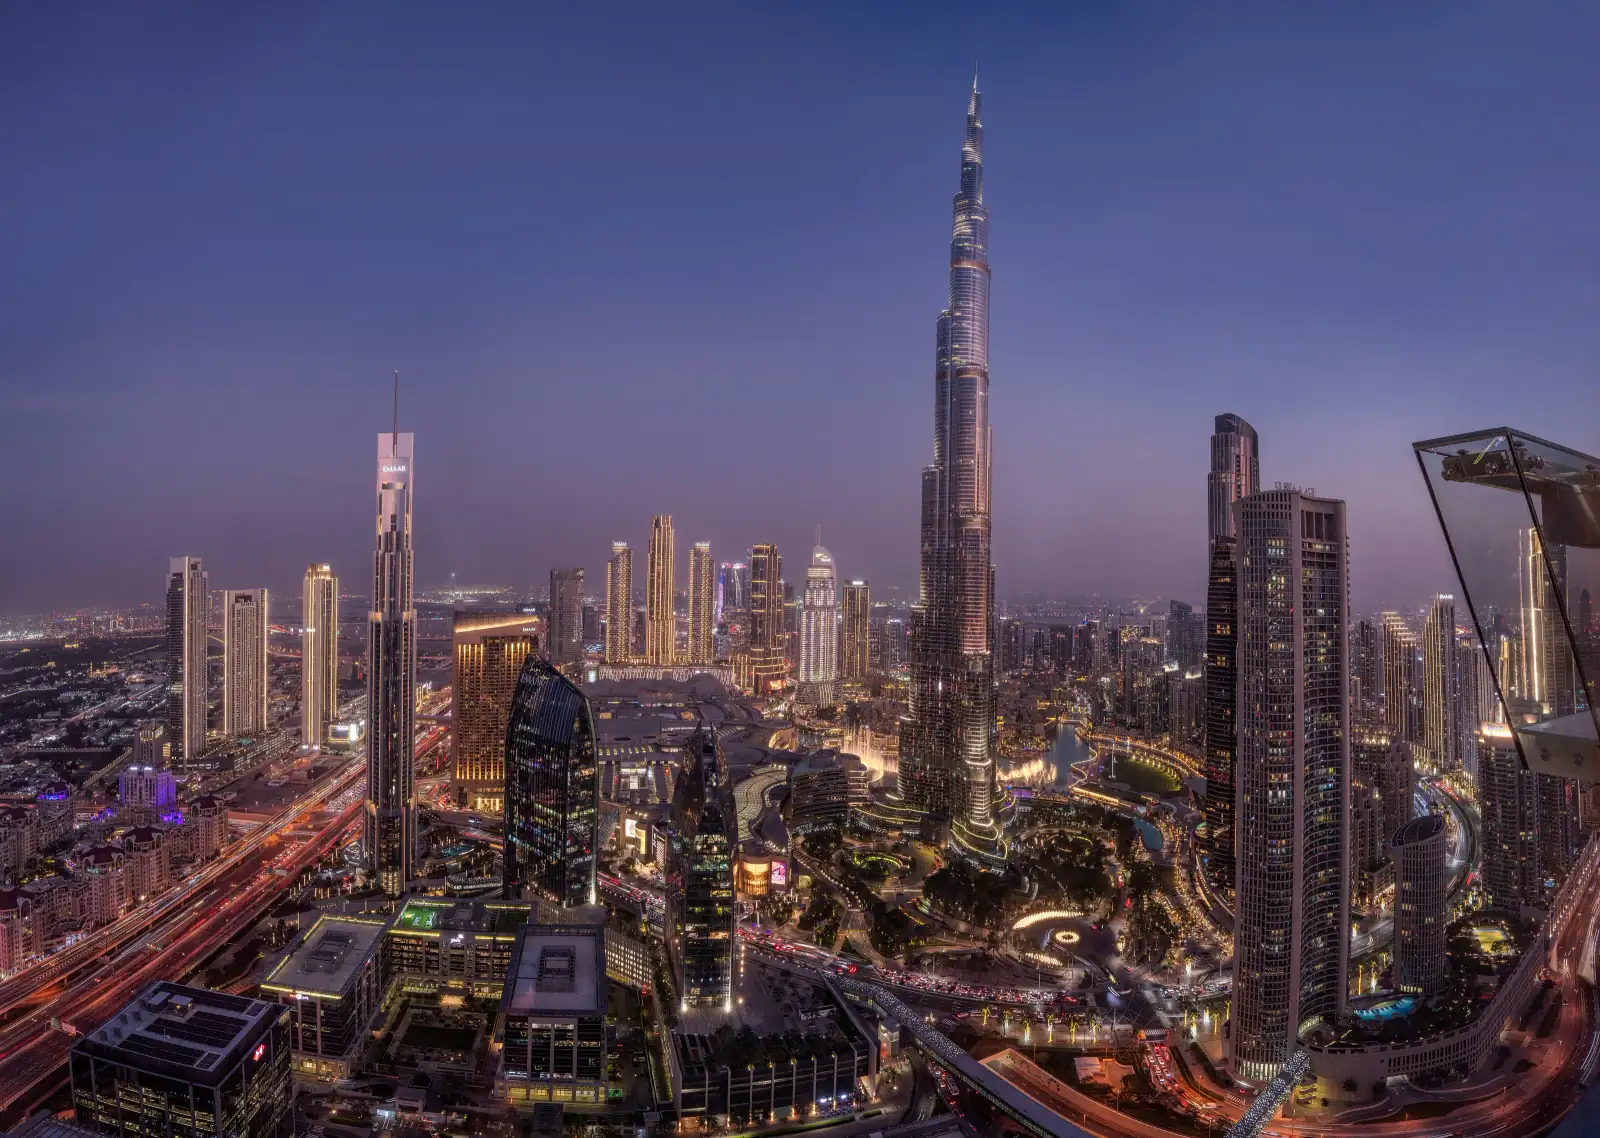
Areas in Dubai.
Compare registered sales, prices and yields across areas.
139 areas · Data to 3 November 2026
30 of 139 areas · Sorted by Sales, highest first
- DubailandView area
- Sales (highest first)Last 12 months
- 22,932
- Ready priceAED per sq ft
- 1,146
- Ready price, change on the yearSame home types
- +8.9%
- Gross yieldBefore costs
- 7.4%
- Dubai SouthView area
- Sales (highest first)Last 12 months
- 16,132
- Ready priceAED per sq ft
- 1,131
- Ready price, change on the yearSame home types
- +9.1%
- Gross yieldBefore costs
- 7.4%
- Jumeirah Village CircleView area
- Sales (highest first)Last 12 months
- 10,995
- Ready priceAED per sq ft
- 1,301
- Ready price, change on the yearSame home types
- +4.2%
- Gross yieldBefore costs
- 7%
- Jabal Ali FirstView area
- Sales (highest first)Last 12 months
- 6,576
- Ready priceAED per sq ft
- 1,112
- Ready price, change on the yearSame home types
- +7.2%
- Gross yieldBefore costs
- 8.7%
- Dubai Land Residence ComplexView area
- Sales (highest first)Last 12 months
- 6,502
- Ready priceAED per sq ft
- 817
- Ready price, change on the yearSame home types
- -0.9%
- Gross yieldBefore costs
- 8.7%
- MajanView area
- Sales (highest first)Last 12 months
- 6,086
- Ready priceAED per sq ft
- 927
- Ready price, change on the yearSame home types
- -7.1%
- Gross yieldBefore costs
- 8.1%
- Business BayView area
- Sales (highest first)Last 12 months
- 5,673
- Ready priceAED per sq ft
- 1,856
- Ready price, change on the yearSame home types
- +3.7%
- Gross yieldBefore costs
- 6.2%
- Dubai Investment ParkView area
- Sales (highest first)Last 12 months
- 5,191
- Ready priceAED per sq ft
- 830
- Ready price, change on the yearSame home types
- +5.8%
- Gross yieldBefore costs
- 10.5%
- Dubai IslandsView area
- Sales (highest first)Last 12 months
- 4,379
- Ready priceAED per sq ft
- 2,264
- Ready price, change on the yearSame home types
- —
- Gross yieldBefore costs
- 4.9%
- Dubai Creek HarbourView area
- Sales (highest first)Last 12 months
- 3,884
- Ready priceAED per sq ft
- 2,320
- Ready price, change on the yearSame home types
- +2.6%
- Gross yieldBefore costs
- 5.7%
- Al Yelayiss 1View area
- Sales (highest first)Last 12 months
- 3,863
- Ready priceAED per sq ft
- 1,250
- Ready price, change on the yearSame home types
- +9.5%
- Gross yieldBefore costs
- 5%
- Al Hebiah FifthView area
- Sales (highest first)Last 12 months
- 3,726
- Ready priceAED per sq ftHomes only
- 946
- Ready price, change on the yearSame home types
- +6.6%
- Gross yieldBefore costs
- 8.4%
- Jumeirah Village TriangleView area
- Sales (highest first)Last 12 months
- 3,662
- Ready priceAED per sq ft
- 1,311
- Ready price, change on the yearSame home types
- +20.7%
- Gross yieldBefore costs
- 7.4%
- ArjanView area
- Sales (highest first)Last 12 months
- 3,652
- Ready priceAED per sq ft
- 1,361
- Ready price, change on the yearSame home types
- +10.4%
- Gross yieldBefore costs
- 7.8%
- Motor CityView area
- Sales (highest first)Last 12 months
- 3,473
- Ready priceAED per sq ft
- 1,008
- Ready price, change on the yearSame home types
- +9.7%
- Gross yieldBefore costs
- 7.8%
- Mohammed Bin Rashid CityView area
- Sales (highest first)Last 12 months
- 3,388
- Ready priceAED per sq ft
- 1,980
- Ready price, change on the yearSame home types
- -0.1%
- Gross yieldBefore costs
- 6%
- Meydan CityView area
- Sales (highest first)Last 12 months
- 3,330
- Ready priceAED per sq ft
- 1,930
- Ready price, change on the yearSame home types
- +2.9%
- Gross yieldBefore costs
- 7%
- Dubai MarinaView area
- Sales (highest first)Last 12 months
- 3,322
- Ready priceAED per sq ft
- 1,981
- Ready price, change on the yearSame home types
- +9%
- Gross yieldBefore costs
- 5.4%
- International CityView area
- Sales (highest first)Last 12 months
- 3,045
- Ready priceAED per sq ft
- 706
- Ready price, change on the yearSame home types
- +4.9%
- Gross yieldBefore costs
- 10%
- Dubai Production CityView area
- Sales (highest first)Last 12 months
- 3,037
- Ready priceAED per sq ft
- 992
- Ready price, change on the yearSame home types
- +6.7%
- Gross yieldBefore costs
- 9.5%
- City of ArabiaView area
- Sales (highest first)Last 12 months
- 2,933
- Ready priceAED per sq ft
- 939
- Ready price, change on the yearSame home types
- —
- Gross yieldBefore costs
- 9.8%
- Dubai Sports CityView area
- Sales (highest first)Last 12 months
- 2,872
- Ready priceAED per sq ft
- 968
- Ready price, change on the yearSame home types
- +6.6%
- Gross yieldBefore costs
- 8.7%
- Dubai Maritime CityView area
- Sales (highest first)Last 12 months
- 2,809
- Ready priceAED per sq ft
- 2,015
- Ready price, change on the yearSame home types
- -0.4%
- Gross yieldBefore costs
- 4.6%
- Dubai Hills EstateView area
- Sales (highest first)Last 12 months
- 2,791
- Ready priceAED per sq ft
- 2,318
- Ready price, change on the yearSame home types
- +2.4%
- Gross yieldBefore costs
- 6%
- DAMAC LagoonsView area
- Sales (highest first)Last 12 months
- 2,760
- Ready priceAED per sq ftToo few registered as homes
- —
- Ready price, change on the yearSame home types
- —
- Gross yieldBefore costs
- —
- Jebel AliView area
- Sales (highest first)Last 12 months
- 2,681
- Ready priceAED per sq ft
- 1,296
- Ready price, change on the yearSame home types
- +7.2%
- Gross yieldBefore costs
- 8.3%
- Nad Al Shiba FirstView area
- Sales (highest first)Last 12 months
- 2,587
- Ready priceAED per sq ft
- 1,930
- Ready price, change on the yearSame home types
- +6.1%
- Gross yieldBefore costs
- 6.6%
- Al JaddafView area
- Sales (highest first)Last 12 months
- 2,579
- Ready priceAED per sq ft
- 1,777
- Ready price, change on the yearSame home types
- +16%
- Gross yieldBefore costs
- 5.7%
- Downtown DubaiView area
- Sales (highest first)Last 12 months
- 2,272
- Ready priceAED per sq ft
- 2,483
- Ready price, change on the yearSame home types
- -0.6%
- Gross yieldBefore costs
- 5.4%
- BukadraView area
- Sales (highest first)Last 12 months
- 2,190
- Ready priceAED per sq ftToo few registered as homes
- —
- Ready price, change on the yearSame home types
- —
- Gross yieldBefore costs
- —
Sales are those registered in the last 12 months; their change compares the number of sales with the 12 months before, provided that period had at least 20 sales. The ready price change compares the median ready price per sq ft of the same home types (at least 5 sales of each in both years) with the 12 months before, as on each area page. Prices are medians of all registered sales, shown when there are at least 5. Gross yield is the median new yearly rent over the ready median price of the area’s most rented home type with a yield (named under it), before service charges and other costs. Each area page has the same figures by bedrooms. Where most of an area’s sales in a market are plots or whole buildings, its price counts homes only (marked “Homes only”), or is left out where too few sales are registered as homes (“Too few registered as homes”).
Source: Dubai Land Department open data, published on Dubai Data under the Dubai Data Open Data Licence: registered sales and new rent contracts. Medians use at least 5 transactions.