

Area profile
Dubai Islands
Deira Islands · Dubai
In the 12 months to 3 November 2026, registered sales rose 18.6% to 4,379.
In DLD records: Palm Deira
- Median ready pricePer sq ft
- AED 2,264
- Registered salesLast 12 months
- 4,379
Data to 3 November 2026
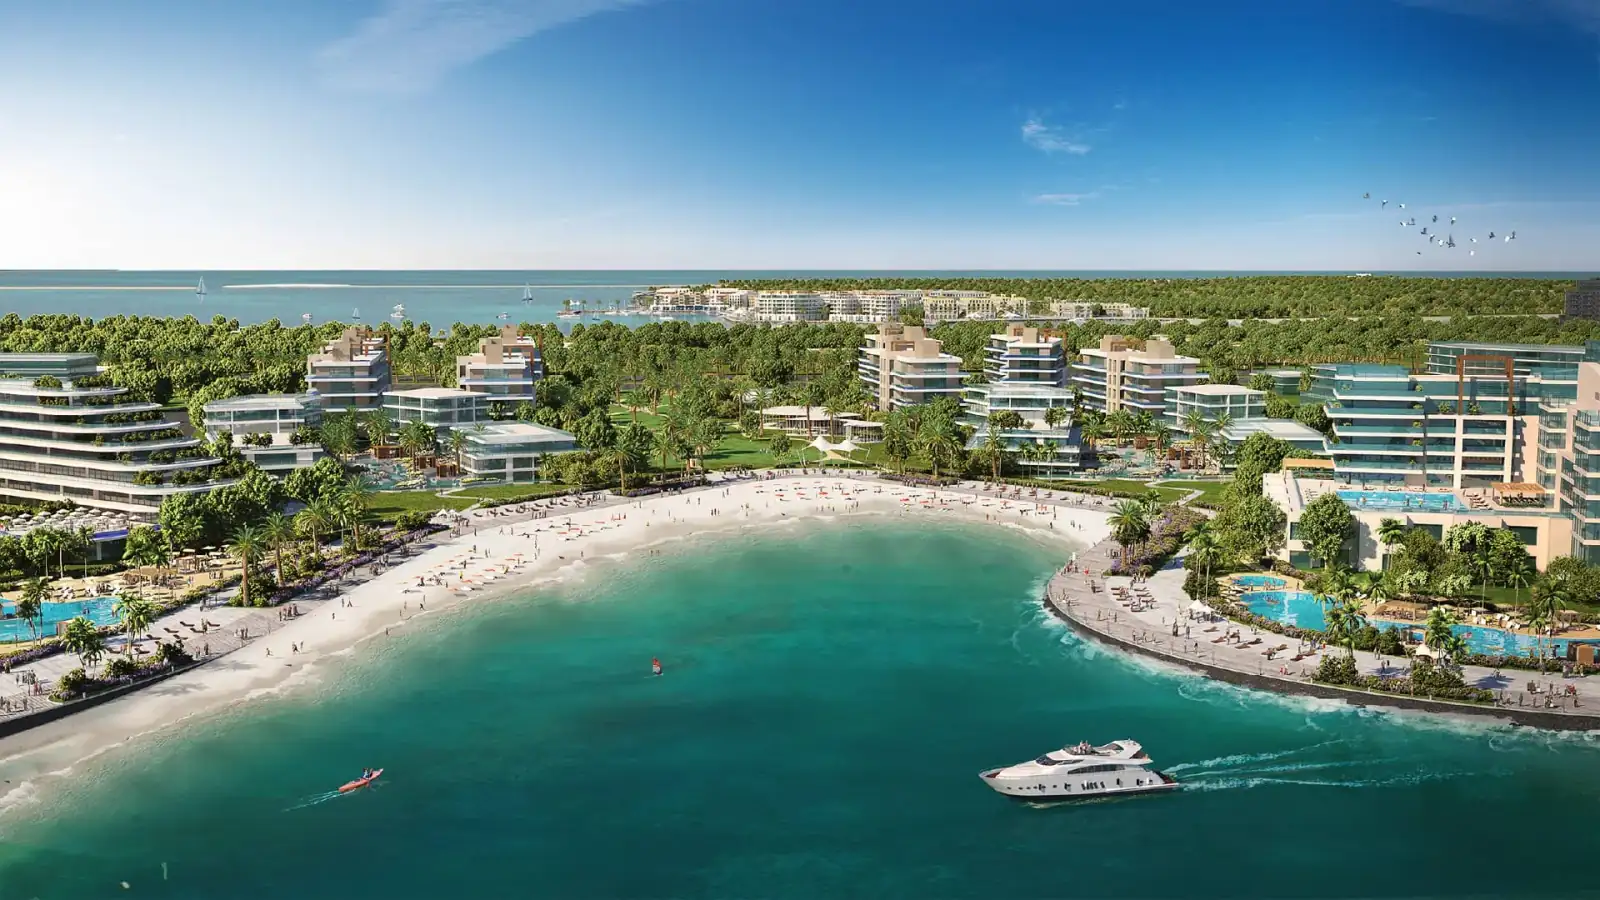
In the last 12 months, Dubai Land Department registered 4,379 sales in Dubai Islands, worth AED 15.1B in total. The number of sales was 18.6% higher than in the 12 months before. The median price was 2,756 AED/sqft off-plan and 2,264 AED/sqft for ready homes.
Source: Dubai Land Department open data, published on Dubai Data under the Dubai Data Open Data Licence: registered sales and new rent contracts. Medians use at least 5 transactions. Asking prices are aggregates of property portal listings.
Prices, over time.
Median registered price, AED per sq ft
Show the figures
| Month | Off-plan (registered sales) |
|---|---|
| Nov 2023 | 2,513 AED/sqft 214 sales |
| Dec 2023 | 2,504 AED/sqft 110 sales |
| Jan 2024 | 2,567 AED/sqft 93 sales |
| Feb 2024 | 2,569 AED/sqft 48 sales |
| Mar 2024 | 2,562 AED/sqft 17 sales |
| Apr 2024 | 2,564 AED/sqft 20 sales |
| May 2024 | 1,767 AED/sqft 28 sales |
| Jun 2024 | 1,771 AED/sqft 12 sales |
| Jul 2024 | 2,579 AED/sqft 99 sales |
| Aug 2024 | 1,943 AED/sqft 122 sales |
| Sep 2024 | 1,985 AED/sqft 155 sales |
| Oct 2024 | 2,084 AED/sqft 112 sales |
| Nov 2024 | 2,145 AED/sqft 225 sales |
| Dec 2024 | 2,179 AED/sqft 157 sales |
| Jan 2025 | 2,077 AED/sqft 90 sales |
| Feb 2025 | 2,200 AED/sqft 278 sales |
| Mar 2025 | 2,395 AED/sqft 323 sales |
| Apr 2025 | 2,415 AED/sqft 419 sales |
| May 2025 | 2,434 AED/sqft 386 sales |
| Jun 2025 | 2,398 AED/sqft 397 sales |
| Jul 2025 | 2,324 AED/sqft 290 sales |
| Aug 2025 | 2,371 AED/sqft 206 sales |
| Sep 2025 | 2,328 AED/sqft 437 sales |
| Oct 2025 | 2,519 AED/sqft 469 sales |
| Nov 2025 | 2,658 AED/sqft 461 sales |
| Dec 2025 | 2,648 AED/sqft 467 sales |
| Jan 2026 | 2,696 AED/sqft 613 sales |
| Feb 2026 | 2,869 AED/sqft 600 sales |
| Mar 2026 | 2,774 AED/sqft 424 sales |
| Apr 2026 | 3,000 AED/sqft 698 sales |
| May 2026 | 3,040 AED/sqft 349 sales |
| Jun 2026 | 2,707 AED/sqft 202 sales |
| Jul 2026 | 2,588 AED/sqft 163 sales |
| Aug 2026 | 2,460 AED/sqft 122 sales |
| Sep 2026 | 2,423 AED/sqft 121 sales |
| Oct 2026 | 2,458 AED/sqft 136 sales |
Where the change in sales came from.
Registered sales in the last 12 months against the 12 months before, by DLD registration type, beside all of Dubai.
- Off-plan+17.9%Off-plan sales rose by 17.9%, from 3,692 to 4,354.Dubai: -9.9%
- Ready2525 ready sales, against 1 in the 12 months before.Dubai: -27.8%
The projects whose number of sales moved most
- Hado By Beyond629 sales, against 0
- The Meriva Collection509 sales, against 0
- Ellington Sands I434 sales, against 0
Counts of registered sales, not prices: a project’s count follows its launches and how many homes it has left to sell.
What does each home type look like?
Apartment · 1 bed
- Ready median price
- AED 2M
- Median yearly rent
- AED 100K
- Gross yield
- 4.9%
Apartment · 2 beds
- Ready median price
- AED 2.8M
- Median yearly rent
- AED 117.7K
- Gross yield
- 4.2%
Apartment · 3 beds
- Ready median price
- —
- Median yearly rent
- —
- Gross yield
- —
Apartment · 4 beds
- Ready median price
- —
- Median yearly rent
- —
- Gross yield
- —
Last 12 months. Medians of at least 5 registered sales or new rent contracts; the median price of all sales mixes ready and off-plan. Gross yield is the median new yearly rent over the ready median price, shown where a home type has at least 10 ready sales and 5 new rents (“rent only” otherwise), before service charges and other costs.
Off-plan or ready.
Off-plan premium, same home type
Apartment · 1 bed: off-plan homes sold at 21.1% above ready ones per sq ft in the last 12 months (2,775 AED/sqft against 2,292 AED/sqft, medians of 1,984 and 11 sales).
Same home type, not the same buildings: off-plan stock is often newer, so the gap is not a forecast of resale prices. Not investment advice.
The middle half of prices
Middle half of Apartment · 1 bed · Off-plan sales: AED 2,393–3,112 per sq ft (AED 2,078,000–2,618,000), 1,984 sales in the last 12 months. The full spread by home type is in the area report.
A quarter of these sales were below the band and a quarter above it. Registered sales, not a valuation.
Future supply
14,885
Homes under construction or planned, in 122 projects
- Finished190 homes3 projects
- Under construction10,037 homes95 projects
- Planned or on hold4,848 homes27 projects
- Pipeline per finished home
- —Too few finished homes in the register to compare
- Homes due in the next 24 months
- 9,082Under construction or planned, with a DLD end date in that time
13 projects (1,281 homes) are past their DLD end date.
The project-by-project handover calendar is in the area reportFrom the DLD project register for this area, counting apartments and villas. Records still not finished more than 5 years after their DLD end date are left out as stale.
Sales of AED 2M or more.
90.6%
90.6% of the area’s home sales in the last 12 months were for AED 2M or more (3,964 of 4,377). Dubai: 33%.
AED 2M is the minimum total property value for the UAE’s 10-year Golden Residence (golden visa) for real-estate investors, according to ICP and GDRFA Dubai (rules checked on 5 November 2026). This count shows registered sale prices only; the authorities decide each application on their own conditions, such as the owner’s share, how the value is certified and how the home is financed.
- ICP: UAE Golden Residency, conditions for real-estate investors
- GDRFA Dubai: golden residence permit for investors
Home sales of the last 12 months, every home type together. The area report has every price band, by home type.
Projects in Deira Islands
Browse all projects- Hado By Beyond629 sales in 24 monthsView project
- The Meriva Collection509 sales in 24 monthsView project
- Ellington Sands I434 sales in 24 monthsView project
- Ellington Sands II428 sales in 24 monthsView project
- Bay Grove Residences C - Dubai Islands369 sales in 24 monthsView project
- Bay Grove Residences, Dubai Islands307 sales in 24 monthsView project
- Bay Grove Residences D - Dubai Islands258 sales in 24 monthsView project
- Bay Grove Residences B - Dubai Islands242 sales in 24 monthsView project
The latest registered sales.
| Date | Project | Unit | Size | Price | AED/sqft |
|---|---|---|---|---|---|
| 3 Nov 2026 | Silena ResidencesSilena Building B | Penthouse · Off-plan | 12,512 sqft | AED 58,000,000 | 4,636 |
| 3 Nov 2026 | The Meriva CollectionMeriva Shores B | Apartment · 3 beds · Off-plan | 1,764 sqft | AED 6,389,828 | 3,622 |
| 3 Nov 2026 | Beach Walk Residences 2 | Apartment · 3 beds · Ready | 2,523 sqft | AED 4,937,880 | 1,957 |
| 3 Nov 2026 | KaiaBuilding A | Apartment · 2 beds · Off-plan | 1,550 sqft | AED 3,305,616 | 2,133 |
| 3 Nov 2026 | Ocean Crest by SD | Apartment · 2 beds · Off-plan | 1,171 sqft | AED 3,029,000 | 2,587 |
| 3 Nov 2026 | Beach Walk Residences 2 | Apartment · 2 beds · Ready | 1,369 sqft | AED 3,006,094 | 2,196 |
| 3 Nov 2026 | Beach Walk Residences 2 | Apartment · 2 beds · Ready | 1,391 sqft | AED 2,956,301 | 2,125 |
| 3 Nov 2026 | Beach Walk Residences 2 | Apartment · 2 beds · Ready | 1,171 sqft | AED 2,776,527 | 2,371 |
| 3 Nov 2026 | The Meriva CollectionMeriva Gardens A | Apartment · 1 bed · Off-plan | 837 sqft | AED 2,734,828 | 3,267 |
| 3 Nov 2026 | Beach Walk Residences 2 | Apartment · 2 beds · Ready | 1,195 sqft | AED 2,705,115 | 2,264 |
3 Nov 2026
PenthouseOff-plan12,512 sqft
Silena Building BAED 58,000,0004,636 AED/sqft
3 Nov 2026
Apartment3 bedsOff-plan1,764 sqft
Meriva Shores BAED 6,389,8283,622 AED/sqft
3 Nov 2026
Apartment3 bedsReady2,523 sqft
AED 4,937,8801,957 AED/sqft
3 Nov 2026
Apartment2 bedsOff-plan1,550 sqft
Building AAED 3,305,6162,133 AED/sqft
3 Nov 2026
Apartment2 bedsOff-plan1,171 sqft
AED 3,029,0002,587 AED/sqft
3 Nov 2026
Apartment2 bedsReady1,369 sqft
AED 3,006,0942,196 AED/sqft
3 Nov 2026
Apartment2 bedsReady1,391 sqft
AED 2,956,3012,125 AED/sqft
3 Nov 2026
Apartment2 bedsReady1,171 sqft
AED 2,776,5272,371 AED/sqft
3 Nov 2026
Apartment1 bedOff-plan837 sqft
Meriva Gardens AAED 2,734,8283,267 AED/sqft
3 Nov 2026
Apartment2 bedsReady1,195 sqft
AED 2,705,1152,264 AED/sqft
Asking prices against sales
- Property portal asking prices1.3%below registered sale pricesMedian gap across 3 segments
Property portal asking prices are compared with registered sales per segment (same market, property type and bedrooms), only where there are at least 10 listings and 10 sales. No individual listing is shown.
Questions about Dubai Islands
What is the price per sq ft in Dubai Islands?
In the 12 months to 3 November 2026, the median registered sale price was 2,264 AED/sqft for ready homes and 2,756 AED/sqft off-plan. The two medians mix different home types.
How did prices and sales in Dubai Islands change over the last year?
In the 12 months to 3 November 2026, registered sales rose 18.6% to 4,379.
How many homes are under construction or planned in Dubai Islands?
As of 3 November 2026, the DLD project register lists 14,885 homes under construction or planned in Dubai Islands, 9,082 of them in projects with a DLD end date in the next 24 months. An end date is the date in the DLD register, not a handover forecast.
Where do these figures come from?
From Dubai Land Department open data, published on Dubai Data, to 3 November 2026: registered sales, new rent contracts and the project register. They are registered sales, not a valuation, and not investment advice.
To buy or rent
Looking to buy or rent in Dubai Islands?
Leave your details and partner agents who work in Dubai Islands can send you homes for sale or rent that match what you are looking for.
Own a unit in Dubai Islands? See what it is worth on My Unit Worth