

Area profile
Jumeirah
Jumeirah 1 · Dubai
In the 12 months to 3 November 2026, the ready price per sq ft of the same home types rose 10.7% (Dubai +6.5%), and registered sales fell 16.9% to 432.
In DLD records: Jumeirah First, Jumeirah Second, Jumeirah Third
- Median ready pricePer sq ft
- AED 2,886
- Ready price, 1-year changeSame home types, n ≥ 5 · 97% of ready sales
- +10.7% Dubai +6.5%
- Ready price, 3-year changeSame home types, n ≥ 5 · 97% of ready sales
- +25.2% Dubai +31.4%
- Registered salesLast 12 months
- 432
Data to 3 November 2026
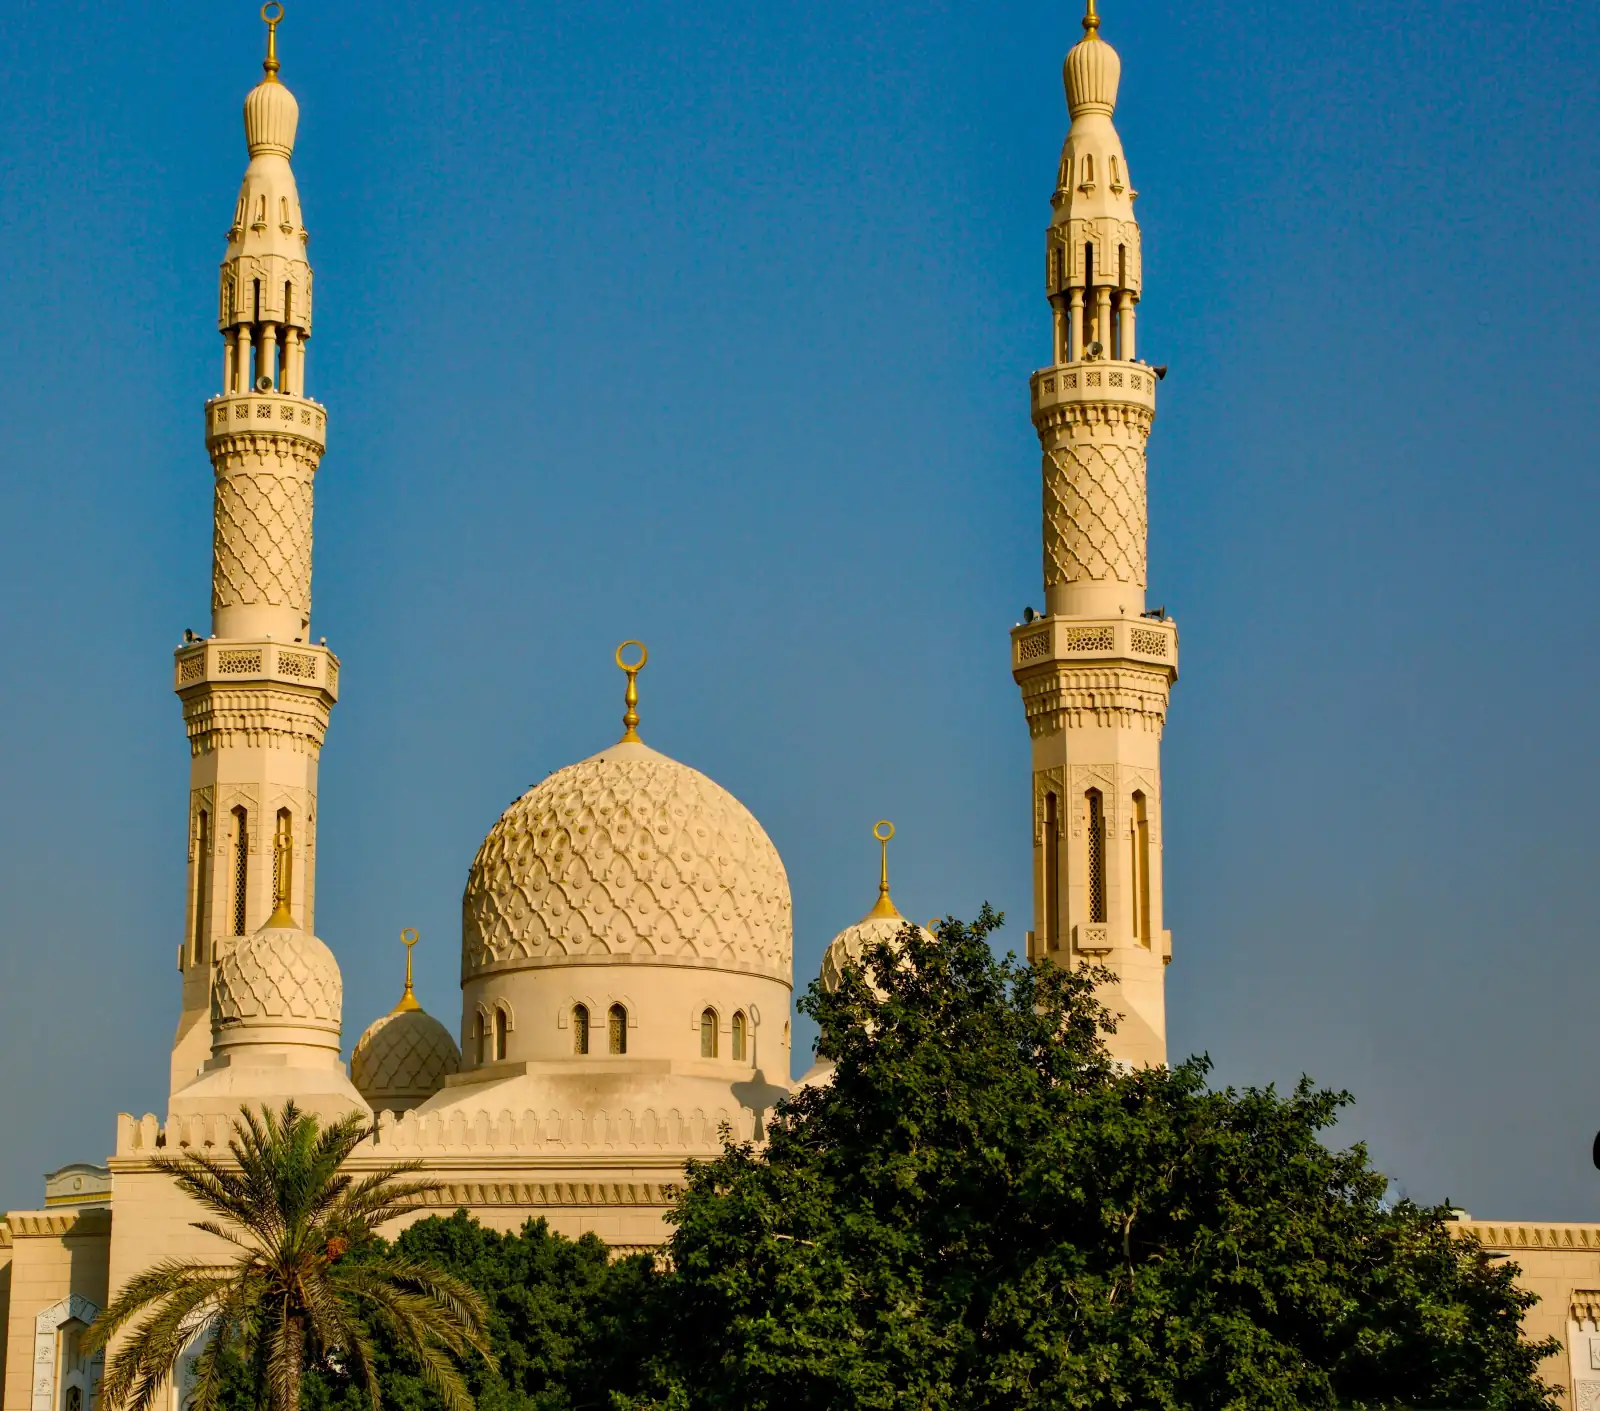
In the last 12 months, Dubai Land Department registered 432 sales in Jumeirah, worth AED 10.5B in total. The number of sales was 16.9% lower than in the 12 months before. The median price was 7,354 AED/sqft off-plan and 2,886 AED/sqft for ready homes.
Source: Dubai Land Department open data, published on Dubai Data under the Dubai Data Open Data Licence: registered sales and new rent contracts. Medians use at least 5 transactions.
Prices, over time.
Median registered price, AED per sq ft
- Ready (registered sales)
- Off-plan (registered sales)
Show the figures
| Month | Ready (registered sales) | Off-plan (registered sales) |
|---|---|---|
| Nov 2023 | 2,667 AED/sqft 11 sales | — 3 sales |
| Dec 2023 | 2,699 AED/sqft 10 sales | — 2 sales |
| Jan 2024 | — 3 sales | — 3 sales |
| Feb 2024 | 2,660 AED/sqft 12 sales | — 4 sales |
| Mar 2024 | 2,671 AED/sqft 19 sales | — 1 sale |
| Apr 2024 | 2,819 AED/sqft 7 sales | 2,712 AED/sqft 12 sales |
| May 2024 | 2,954 AED/sqft 9 sales | 3,047 AED/sqft 8 sales |
| Jun 2024 | 2,794 AED/sqft 11 sales | 4,242 AED/sqft 28 sales |
| Jul 2024 | 2,972 AED/sqft 10 sales | 4,112 AED/sqft 34 sales |
| Aug 2024 | 2,548 AED/sqft 8 sales | 4,677 AED/sqft 15 sales |
| Sep 2024 | 2,893 AED/sqft 6 sales | 2,985 AED/sqft 6 sales |
| Oct 2024 | 2,660 AED/sqft 15 sales | 4,864 AED/sqft 12 sales |
| Nov 2024 | 2,602 AED/sqft 18 sales | — 3 sales |
| Dec 2024 | 2,836 AED/sqft 15 sales | 4,020 AED/sqft 7 sales |
| Jan 2025 | 2,866 AED/sqft 19 sales | 4,183 AED/sqft 5 sales |
| Feb 2025 | 2,936 AED/sqft 14 sales | 4,024 AED/sqft 11 sales |
| Mar 2025 | 2,900 AED/sqft 19 sales | — 2 sales |
| Apr 2025 | 2,909 AED/sqft 31 sales | 3,150 AED/sqft 10 sales |
| May 2025 | 3,097 AED/sqft 24 sales | 7,280 AED/sqft 48 sales |
| Jun 2025 | 2,739 AED/sqft 14 sales | 7,516 AED/sqft 39 sales |
| Jul 2025 | 2,854 AED/sqft 14 sales | 7,537 AED/sqft 49 sales |
| Aug 2025 | 3,104 AED/sqft 7 sales | 4,141 AED/sqft 8 sales |
| Sep 2025 | 3,079 AED/sqft 11 sales | 7,315 AED/sqft 23 sales |
| Oct 2025 | 2,863 AED/sqft 20 sales | 7,375 AED/sqft 22 sales |
| Nov 2025 | 2,915 AED/sqft 16 sales | 6,938 AED/sqft 64 sales |
| Dec 2025 | 3,055 AED/sqft 12 sales | 7,273 AED/sqft 47 sales |
| Jan 2026 | 3,000 AED/sqft 17 sales | 7,170 AED/sqft 20 sales |
| Feb 2026 | 3,798 AED/sqft 22 sales | 7,161 AED/sqft 9 sales |
| Mar 2026 | 3,549 AED/sqft 17 sales | 8,036 AED/sqft 16 sales |
| Apr 2026 | 2,764 AED/sqft 7 sales | 11,784 AED/sqft 14 sales |
| May 2026 | — 4 sales | 7,848 AED/sqft 11 sales |
| Jun 2026 | 2,768 AED/sqft 9 sales | 7,572 AED/sqft 6 sales |
| Jul 2026 | 2,878 AED/sqft 15 sales | 8,134 AED/sqft 23 sales |
| Aug 2026 | — 4 sales | 8,326 AED/sqft 8 sales |
| Sep 2026 | 3,070 AED/sqft 13 sales | — 1 sale |
| Oct 2026 | 3,877 AED/sqft 9 sales | — 1 sale |
Where the change in sales came from.
Registered sales in the last 12 months against the 12 months before, by DLD registration type, beside all of Dubai.
- Off-plan-5.6%Off-plan sales fell by 5.6%, from 232 to 219.Dubai: -9.9%
- Ready-26%Ready sales fell by 26%, from 288 to 213.Dubai: -27.8%
The projects whose number of sales moved most
- Solaya (1,2,3)67 sales, against 0
- Peninsula Dubai Residences - Tower 110 sales, against 52
- Solaya (4,6)40 sales, against 0
Counts of registered sales, not prices: a project’s count follows its launches and how many homes it has left to sell.
What does each home type look like?
Apartment · Studio
- Ready median price
- —
- Median yearly rent
- AED 54K
- Gross yield
- Rent only
Apartment · 1 bed
- Ready median price
- AED 2.3M
- Median yearly rent
- AED 105K
- Gross yield
- 4.6%
Apartment · 2 beds
- Ready median price
- AED 4.4M
- Median yearly rent
- AED 180K
- Gross yield
- 4.1%
Apartment · 3 beds
- Ready median price
- AED 9.4M
- Median yearly rent
- AED 325K
- Gross yield
- 3.5%
Apartment · 4 beds
- Ready median price
- AED 13.7M
- Median yearly rent
- AED 500K
- Gross yield
- 3.6%
Apartment · 5 beds
- Ready median price
- —
- Median yearly rent
- —
- Gross yield
- —
Villa or townhouse · 2 beds
- Ready median price
- —
- Median yearly rent
- AED 80K
- Gross yield
- Rent only
Villa or townhouse · 3 beds
- Ready median price
- —
- Median yearly rent
- AED 230K
- Gross yield
- Rent only
Villa or townhouse · 4 beds
- Ready median price
- —
- Median yearly rent
- AED 300K
- Gross yield
- Rent only
Villa or townhouse · 5 beds
- Ready median price
- —
- Median yearly rent
- AED 365K
- Gross yield
- Rent only
Villa or townhouse · 6 beds
- Ready median price
- —
- Median yearly rent
- AED 500K
- Gross yield
- Rent only
Villa or townhouse · 7 beds
- Ready median price
- —
- Median yearly rent
- AED 350K
- Gross yield
- Rent only
Last 12 months. Medians of at least 5 registered sales or new rent contracts; the median price of all sales mixes ready and off-plan. Gross yield is the median new yearly rent over the ready median price, shown where a home type has at least 10 ready sales and 5 new rents (“rent only” otherwise), before service charges and other costs.
Off-plan or ready.
Off-plan premium, same home type
Apartment · 2 beds: off-plan homes sold at 125.6% above ready ones per sq ft in the last 12 months (7,665 AED/sqft against 3,398 AED/sqft, medians of 60 and 57 sales).
Same home type, not the same buildings: off-plan stock is often newer, so the gap is not a forecast of resale prices. Not investment advice.
The middle half of prices
Middle half of Apartment · 3 beds · Off-plan sales: AED 6,905–8,073 per sq ft (AED 24,388,000–34,832,000), 81 sales in the last 12 months. The full spread by home type is in the area report.
A quarter of these sales were below the band and a quarter above it. Registered sales, not a valuation.
Off-plan to ready, around completion
For 5 of the 10 projects in this area completed between 2021 and 2024 (DLD project register), the median project’s ready price per sq ft in the 12 months after completion was 18.4% above its off-plan price per sq ft in the 12 months before.
Dubai’s price index rose by 13.1% over the same months (the median across these projects).
Dubai’s counted projects completed in those years, worked out the same way: 15.3% above.
This is history, not a forecast. These projects were completed in years when Dubai prices were rising, and the earliest windows start in the 2020–21 low. Only completed projects with at least 10 registered sales in each window count, and a project needs the full 12 months after completion first: one completed within the last 12 months is in the total but not yet counted. Projects not yet completed or cancelled are not included. DLD records do not separate a developer’s own sales from resales by earlier buyers, and the two windows cover different homes and unit mixes. The step and the index move are context for each other, not a difference to subtract: each is a median across the projects. Registered sale prices only, before fees, payment-plan terms, financing, service charges and rent: registered sales, not a valuation, and not investment advice.
Future supply
567
Homes under construction or planned, in 11 projects
- Finished1,885 homes13 projects
- Under construction335 homes7 projects
- Planned or on hold232 homes4 projects
- Pipeline per finished home
- 0.30×Low pipeline pressure compared with Dubai as a whole (1.17×)
- Homes due in the next 24 months
- 33Under construction or planned, with a DLD end date in that time
1 project (13 homes) is past its DLD end date.
The project-by-project handover calendar is in the area reportFrom the DLD project register for this area, counting apartments and villas. Records still not finished more than 5 years after their DLD end date are left out as stale.
Ready turnover, last 12 months
8%
Ready sales in the last 12 months came to 8% of the 1,885 homes in the area’s finished DLD register projects (150 sales). Dubai: 7.2%.
Ready sales count resales and a developer’s sales of finished homes alike. Not counted, homes or sales: buildings older than the DLD project register, and villa projects whose sales DLD mostly registers as land. DLD data only.
Sales of AED 2M or more.
98%
98% of the area’s home sales in the last 12 months were for AED 2M or more (399 of 407). Dubai: 33%.
AED 2M is the minimum total property value for the UAE’s 10-year Golden Residence (golden visa) for real-estate investors, according to ICP and GDRFA Dubai (rules checked on 5 November 2026). This count shows registered sale prices only; the authorities decide each application on their own conditions, such as the owner’s share, how the value is certified and how the home is financed.
- ICP: UAE Golden Residency, conditions for real-estate investors
- GDRFA Dubai: golden residence permit for investors
Home sales of the last 12 months, every home type together. The area report has every price band, by home type.
Projects in Jumeirah 1
Browse all projectsThe latest registered sales.
| Date | Project | Unit | Size | Price | AED/sqft |
|---|---|---|---|---|---|
| 3 Nov 2026 | — | Villa · Ready | 14,925 sqft | AED 12,260,280 | 821 |
| 3 Nov 2026 | — | Villa · Ready | 8,070 sqft | AED 8,000,000 | 991 |
| 30 Oct 2026 | Port De La Mer - Le SoleilLe Ciel ? Building 3 | Apartment · 1 bed · Ready | 789 sqft | AED 2,400,000 | 3,042 |
| 29 Oct 2026 | Port De La Mer - Le SoleilLe Ciel ? Building 1 | Apartment · 2 beds · Ready | 1,442 sqft | AED 5,700,000 | 3,953 |
| 27 Oct 2026 | Eden House The Canal | Apartment · 4 beds · Ready | 2,969 sqft | AED 13,750,000 | 4,631 |
| 27 Oct 2026 | Peninsula Dubai Residences - Tower 2 | Apartment · 1 bed · Off-plan | 1,017 sqft | AED 8,212,855 | 8,076 |
| 27 Oct 2026 | Port de La Mer - La CoteLa Cote ? Building 2 | Apartment · 3 beds · Ready | 1,973 sqft | AED 7,650,000 | 3,877 |
| 19 Oct 2026 | Eden House The Canal | Apartment · 4 beds · Ready | 3,441 sqft | AED 10,500,000 | 3,051 |
| 19 Oct 2026 | Eden House The Canal | Apartment · 1 bed · Ready | 900 sqft | AED 4,300,000 | 4,778 |
| 13 Oct 2026 | Eden House The Canal | Apartment · 3 beds · Ready | 2,156 sqft | AED 13,000,000 | 6,030 |
3 Nov 2026
—
VillaReady14,925 sqft
AED 12,260,280821 AED/sqft
3 Nov 2026
—
VillaReady8,070 sqft
AED 8,000,000991 AED/sqft
30 Oct 2026
Apartment1 bedReady789 sqft
Le Ciel ? Building 3AED 2,400,0003,042 AED/sqft
29 Oct 2026
Apartment2 bedsReady1,442 sqft
Le Ciel ? Building 1AED 5,700,0003,953 AED/sqft
27 Oct 2026
Apartment4 bedsReady2,969 sqft
AED 13,750,0004,631 AED/sqft
27 Oct 2026
Peninsula Dubai Residences - Tower 2
Apartment1 bedOff-plan1,017 sqft
AED 8,212,8558,076 AED/sqft
27 Oct 2026
Apartment3 bedsReady1,973 sqft
La Cote ? Building 2AED 7,650,0003,877 AED/sqft
19 Oct 2026
Apartment4 bedsReady3,441 sqft
AED 10,500,0003,051 AED/sqft
19 Oct 2026
Apartment1 bedReady900 sqft
AED 4,300,0004,778 AED/sqft
13 Oct 2026
Apartment3 bedsReady2,156 sqft
AED 13,000,0006,030 AED/sqft
Questions about Jumeirah
What is the price per sq ft in Jumeirah?
In the 12 months to 3 November 2026, the median registered sale price was 2,886 AED/sqft for ready homes and 7,354 AED/sqft off-plan. The two medians mix different home types.
How did prices and sales in Jumeirah change over the last year?
In the 12 months to 3 November 2026, the ready price per sq ft of the same home types rose 10.7% (Dubai +6.5%), and registered sales fell 16.9% to 432.
How many homes are under construction or planned in Jumeirah?
As of 3 November 2026, the DLD project register lists 567 homes under construction or planned in Jumeirah, 33 of them in projects with a DLD end date in the next 24 months. An end date is the date in the DLD register, not a handover forecast.
Where do these figures come from?
From Dubai Land Department open data, published on Dubai Data, to 3 November 2026: registered sales, new rent contracts and the project register. They are registered sales, not a valuation, and not investment advice.
To buy or rent
Looking to buy or rent in Jumeirah?
Leave your details and partner agents who work in Jumeirah can send you homes for sale or rent that match what you are looking for.
Own a unit in Jumeirah? See what it is worth on My Unit Worth