

Area profile
Sobha Hartland Sobha Hartland 2 · Dubai · property prices and rents
In the 12 months to 4 November 2026, the ready price per sq ft of the same home types fell 2.1% (Dubai +6.4%), and registered sales fell 14.4% to 1,158. In the last 3 months, the ready price per sq ft of the same home types stood 8.1% below the same months a year before (Dubai +1.6%).
In DLD records: SOBHA HARTLAND
The full Sobha Hartland report
Price growth over 1, 3 and 5 years, rents by home type, service charges and net yield, comparables and every project ranked, with a PDF.
Data to 4 November 2026
- Median ready price
- AED 2,024
- Per sq ft
Median ready price
The median price per sq ft of the ready homes sold in the last 12 months: half sold for more, half for less, so one unusual sale moves it little. Plots and whole buildings are left out; off-plan sales are counted apart.
Price change Ready homes · Same home types
| 3 months | 1 year | 3 years | |
|---|---|---|---|
| Sobha Hartland | -8.1% | -2.1% | +19.5% |
| Dubai | +1.6% | +6.4% | +31.6% |
3 months: against the same 3 months a year before
Price change
How much the median ready price per sq ft changed. It is worked out home type by home type (class and bedrooms) and weighted by each type’s sales now, so a shift from studios to villas does not read as a change in price.
3 months: the last 3 months against the same months a year before, so a turn in the market shows sooner. 1 year: the last 12 months against the 12 months before. 3 years: the last 12 months against the 12 months that ended three years earlier.
Dubai: the same change for the whole of Dubai, worked out the same way, to read the area against.
5 years: the area report adds the change over 5 years and the yearly growth rate.
A home type counts only with at least 5 ready sales in both periods. Share of the ready sales in the home types compared: 3 months 95% · 1 year 97% · 3 years 97%.
- Registered sales
- 1,158
- Last 12 months
Registered sales
Residential sales registered with the Dubai Land Department in the last 12 months, ready and off-plan, plots and whole buildings included. Mortgages and gifts are not sales and are left out.
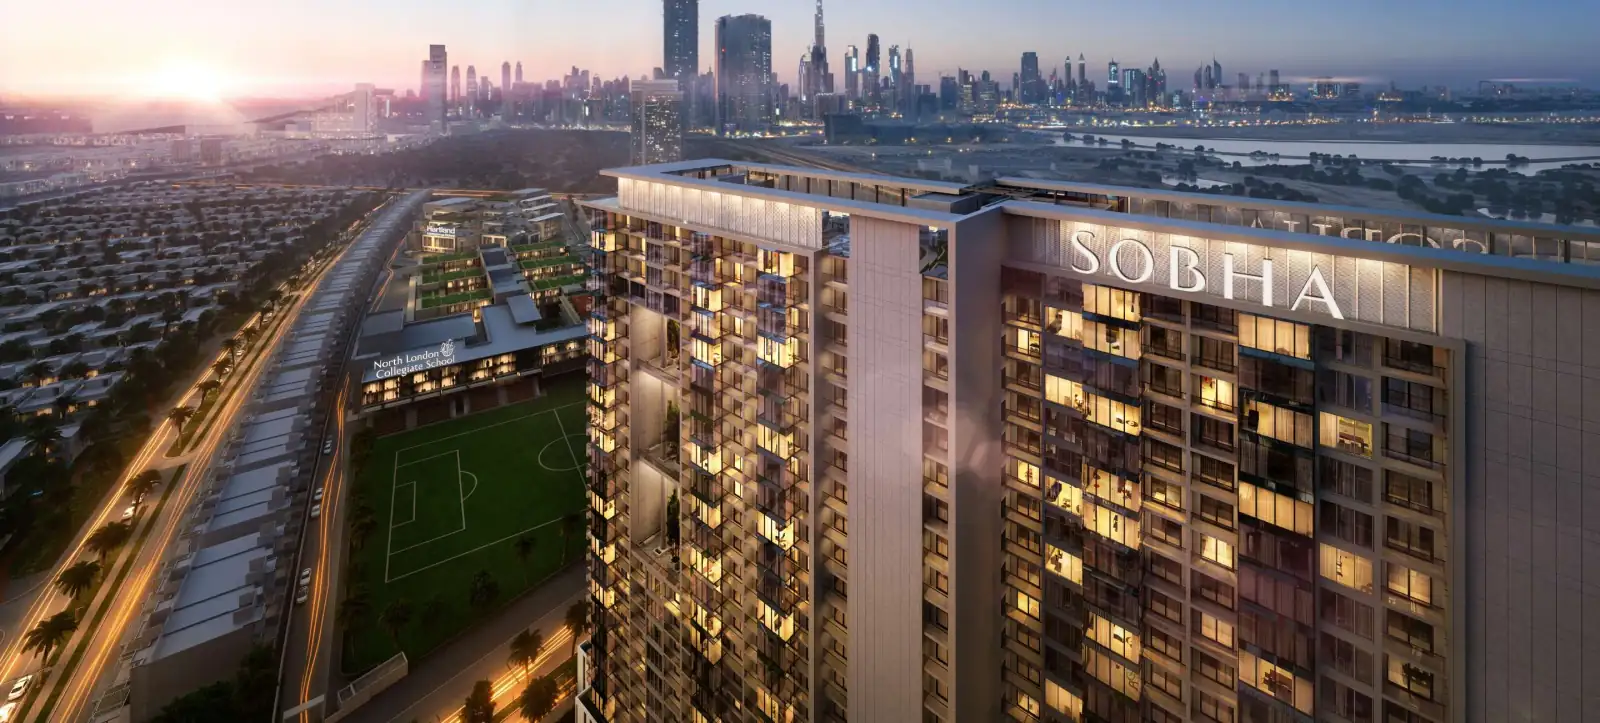
In the last 12 months, Dubai Land Department registered 1,158 sales in Sobha Hartland, worth AED 2.9B in total. The number of sales was 14.4% lower than in the 12 months before. The median price was 2,026 AED/sqft off-plan and 2,024 AED/sqft for ready homes.
Source: Dubai Land Department open data, published on Dubai Data under the Dubai Data Open Data Licence: registered sales and new rent contracts. Medians use at least 5 transactions. Asking prices are aggregates of property portal listings.
Sobha Hartland 2 prices, over time.
Median registered price, AED per sq ft
- Ready (registered sales)
- Off-plan (registered sales)
Show the figures
| Month | Ready (registered sales) | Off-plan (registered sales) |
|---|---|---|
| Nov 2023 | 1,809 AED/sqft 75 sales | 1,926 AED/sqft 182 sales |
| Dec 2023 | 1,845 AED/sqft 74 sales | 1,935 AED/sqft 96 sales |
| Jan 2024 | 1,875 AED/sqft 79 sales | 1,975 AED/sqft 103 sales |
| Feb 2024 | 1,777 AED/sqft 127 sales | 1,953 AED/sqft 87 sales |
| Mar 2024 | 1,915 AED/sqft 106 sales | 1,953 AED/sqft 105 sales |
| Apr 2024 | 1,899 AED/sqft 73 sales | 1,926 AED/sqft 41 sales |
| May 2024 | 1,913 AED/sqft 92 sales | 1,957 AED/sqft 79 sales |
| Jun 2024 | 1,955 AED/sqft 71 sales | 2,019 AED/sqft 75 sales |
| Jul 2024 | 1,904 AED/sqft 71 sales | 1,936 AED/sqft 44 sales |
| Aug 2024 | 1,930 AED/sqft 83 sales | 1,975 AED/sqft 55 sales |
| Sep 2024 | 1,955 AED/sqft 89 sales | 1,951 AED/sqft 38 sales |
| Oct 2024 | 1,983 AED/sqft 46 sales | 1,978 AED/sqft 53 sales |
| Nov 2024 | 2,007 AED/sqft 73 sales | 2,066 AED/sqft 54 sales |
| Dec 2024 | 2,103 AED/sqft 47 sales | 1,919 AED/sqft 54 sales |
| Jan 2025 | 2,057 AED/sqft 45 sales | 1,900 AED/sqft 41 sales |
| Feb 2025 | 1,970 AED/sqft 57 sales | 1,953 AED/sqft 37 sales |
| Mar 2025 | 2,036 AED/sqft 67 sales | 1,927 AED/sqft 33 sales |
| Apr 2025 | 2,129 AED/sqft 67 sales | 2,010 AED/sqft 47 sales |
| May 2025 | 2,117 AED/sqft 90 sales | 1,968 AED/sqft 34 sales |
| Jun 2025 | 2,021 AED/sqft 57 sales | 1,997 AED/sqft 43 sales |
| Jul 2025 | 2,097 AED/sqft 111 sales | 1,972 AED/sqft 15 sales |
| Aug 2025 | 2,110 AED/sqft 88 sales | 2,038 AED/sqft 16 sales |
| Sep 2025 | 2,129 AED/sqft 76 sales | 2,050 AED/sqft 25 sales |
| Oct 2025 | 2,153 AED/sqft 93 sales | 2,027 AED/sqft 33 sales |
| Nov 2025 | 2,117 AED/sqft 86 sales | 1,992 AED/sqft 26 sales |
| Dec 2025 | 2,195 AED/sqft 84 sales | 2,050 AED/sqft 39 sales |
| Jan 2026 | 2,133 AED/sqft 96 sales | 1,988 AED/sqft 29 sales |
| Feb 2026 | 2,035 AED/sqft 114 sales | 2,045 AED/sqft 17 sales |
| Mar 2026 | 2,088 AED/sqft 55 sales | 1,990 AED/sqft 24 sales |
| Apr 2026 | 2,102 AED/sqft 51 sales | 2,029 AED/sqft 21 sales |
| May 2026 | 1,989 AED/sqft 52 sales | 1,990 AED/sqft 17 sales |
| Jun 2026 | 1,970 AED/sqft 61 sales | 2,100 AED/sqft 13 sales |
| Jul 2026 | 1,974 AED/sqft 67 sales | 1,978 AED/sqft 10 sales |
| Aug 2026 | 1,925 AED/sqft 71 sales | 2,076 AED/sqft 7 sales |
| Sep 2026 | 1,968 AED/sqft 82 sales | 2,075 AED/sqft 15 sales |
| Oct 2026 | 2,007 AED/sqft 70 sales | 2,077 AED/sqft 14 sales |
Where the change in sales came from.
Registered sales in the last 12 months against the 12 months before, by DLD registration type, beside all of Dubai.
- Off-plan-45.9%Off-plan sales fell by 45.9%, from 429 to 232.Dubai: -10.3%
- Ready+0.2%Ready sales rose by 0.2%, from 924 to 926.Dubai: -27.8%
The projects whose number of sales moved most
- Sobha Creek Vistas Grande33 sales, against 122
- Sobha Hartland - Crest Grande189 sales, against 104
- Sobha Hartland Greens - Phase III30 sales, against 66
Counts of registered sales, not prices: a project’s count follows its launches and how many homes it has left to sell.
What does each home type sell and rent for in Sobha Hartland 2?
Apartment · Studio
- Ready median price
- AED 978K
- Median yearly rent
- AED 67.1K
- Gross yield
- 6.9%
Apartment · 1 bed
- Ready median price
- AED 1.4M
- Median yearly rent
- AED 85K
- Gross yield
- 6.3%
Apartment · 2 beds
- Ready median price
- AED 2.4M
- Median yearly rent
- AED 140K
- Gross yield
- 6%
Apartment · 3 beds
- Ready median price
- AED 3.3M
- Median yearly rent
- AED 188K
- Gross yield
- 5.7%
Apartment · 4 beds
- Ready median price
- AED 4.7M
- Median yearly rent
- AED 250K
- Gross yield
- 5.3%
Villa or townhouse · 4 beds
- Ready median price
- —
- Median yearly rent
- AED 650K
- Gross yield
- Rent only
Villa or townhouse · 5 beds
- Ready median price
- —
- Median yearly rent
- AED 950K
- Gross yield
- Rent only
Last 12 months. Medians of at least 5 registered sales or new rent contracts; the median price of all sales mixes ready and off-plan. Gross yield is the median new yearly rent over the ready median price, shown where a home type has at least 10 ready sales and 5 new rents (“rent only” otherwise), before service charges and other costs.
- Median service charge
- 17.47 AED/sqftA year · median of 15 developments’ owners’ association budgets, 2026Apartment buildings’ budgets; villa and townhouse budgets are left out.
After service charges
Net yield, Apartment · 1 bed: 5.4% after the area’s median service charge (AED 17.47 per sq ft a year, 2026, budgets of 15 developments). Gross yield: 6.3%.
Net yield takes the service charge off the rent. It is still before vacancy, maintenance, agency and DLD fees and mortgage costs, and an owners’ association budget is not any one owner’s bill. How net yield is worked out
Net yield for every home type and every project is in the area reportOff-plan or ready.
Off-plan premium, same home type
Apartment · 1 bed: off-plan homes sold at 3% below ready ones per sq ft in the last 12 months (2,041 AED/sqft against 2,104 AED/sqft, medians of 109 and 446 sales).
Same home type, not the same buildings: off-plan stock is often newer, so the gap is not a forecast of resale prices. Not investment advice.
The middle half of prices
Middle half of Apartment · 1 bed · Ready sales: AED 1,886–2,295 per sq ft (AED 1,170,000–1,589,000), 446 sales in the last 12 months. The full spread by home type is in the area report.
A quarter of these sales were below the band and a quarter above it. Registered sales, not a valuation.
Off-plan to ready, around completion
For 10 of the 15 projects in this area completed between 2021 and 2025 (DLD project register), the median project’s ready price per sq ft in the 12 months after completion was 9.3% above its off-plan price per sq ft in the 12 months before.
Dubai’s price index rose by 8.1% over the same months (the median across these projects).
Dubai’s counted projects completed in those years, worked out the same way: 14.4% above.
This is history, not a forecast. These projects were completed in years when Dubai prices were rising, and the earliest windows start in the 2020–21 low. Only completed projects with at least 10 registered sales in each window count, and a project needs the full 12 months after completion first: one completed within the last 12 months is in the total but not yet counted. Projects not yet completed or cancelled are not included. DLD records do not separate a developer’s own sales from resales by earlier buyers, and the two windows cover different homes and unit mixes. The step and the index move are context for each other, not a difference to subtract: each is a median across the projects. Registered sale prices only, before fees, payment-plan terms, financing, service charges and rent: registered sales, not a valuation, and not investment advice.
Future supply
1,696
Homes under construction or planned, in 2 projects
- Finished8,824 homes20 projects
- Under construction1,696 homes2 projects
- Pipeline per finished home
- 0.19×Low pipeline pressure compared with Dubai as a whole (1.17×)
- Homes due in the next 24 months
- 0Under construction or planned, with a DLD end date in that time
From the DLD project register for this area, counting apartments and villas. Records still not finished more than 5 years after their DLD end date are left out as stale.
Ready turnover, last 12 months
10.2%
Ready sales in the last 12 months came to 10.2% of the 8,824 homes in the area’s finished DLD register projects (903 sales). Dubai: 7.2%.
Ready sales count resales and a developer’s sales of finished homes alike. Not counted, homes or sales: buildings older than the DLD project register, and villa projects whose sales DLD mostly registers as land. DLD data only.
Sales of AED 2M or more.
43%
43% of the area’s home sales in the last 12 months were for AED 2M or more (485 of 1,128). Dubai: 32.9%.
AED 2M is the minimum total property value for the UAE’s 10-year Golden Residence (golden visa) for real-estate investors, according to ICP and GDRFA Dubai (rules checked on 5 November 2026). This count shows registered sale prices only; the authorities decide each application on their own conditions, such as the owner’s share, how the value is certified and how the home is financed.
- ICP: UAE Golden Residency, conditions for real-estate investors
- GDRFA Dubai: golden residence permit for investors
Home sales of the last 12 months, every home type together. The area report has every price band, by home type.
Projects in Sobha Hartland 2
Browse all projects- Sobha Hartland - The Crest424 sales in 24 monthsView project
- Sobha Hartland - Crest Grande293 sales in 24 monthsView project
- Sobha Creek Vista Heights223 sales in 24 monthsView project
- Sobha Creek Vistas208 sales in 24 monthsView project
- Sobha Creek Vistas Grande155 sales in 24 monthsView project
- Sobha Creek vistas Reserve152 sales in 24 monthsView project
- Sobha Hartland Waves135 sales in 24 monthsView project
- Sobha Hartland Greens - Phase III129 sales in 24 monthsView project
The latest registered sales in Sobha Hartland 2.
| Date | Project | Unit | Size | Price | AED/sqft |
|---|---|---|---|---|---|
| 4 Nov 2026 | Sobha Hartland Villas-Phase 1 | Villa · Ready | 6,018 sqft | AED 14,480,000 | 2,406 |
| 4 Nov 2026 | Sobha Hartland Waves Opulence | Apartment · 4 beds · Ready | 2,738 sqft | AED 6,430,000 | 2,348 |
| 4 Nov 2026 | Sobha Hartland - Crest Grande | Apartment · 2 beds · Ready | 1,390 sqft | AED 2,700,000 | 1,942 |
| 4 Nov 2026 | Sobha Hartland - Crest Grande | Apartment · 2 beds · Ready | 1,281 sqft | AED 2,400,000 | 1,874 |
| 3 Nov 2026 | Sobha Hartland Waves Opulence | Apartment · 1 bed · Ready | 899 sqft | AED 1,860,000 | 2,069 |
| 3 Nov 2026 | Sobha Hartland Greens - Phase IIISobha Hartland Greens - Phase III - 2 | Apartment · Studio · Ready | 964 sqft | AED 729,792 | 757 unusually low AED/sq ft for its project |
| 2 Nov 2026 | Sobha Hartland Waves Opulence | Apartment · 2 beds · Ready | 1,618 sqft | AED 2,860,000 | 1,768 |
| 2 Nov 2026 | Sobha Hartland - Crest Grande | Apartment · 2 beds · Ready | 1,481 sqft | AED 2,850,000 | 1,924 |
| 2 Nov 2026 | Sobha Creek Vista HeightsTower B | Apartment · 2 beds · Off-plan | 1,283 sqft | AED 2,377,714 | 1,853 |
| 2 Nov 2026 | Sobha Hartland Waves | Apartment · 2 beds · Ready | 1,118 sqft | AED 2,260,000 | 2,021 |
4 Nov 2026
VillaReady6,018 sqft
AED 14,480,0002,406 AED/sqft
4 Nov 2026
Apartment4 bedsReady2,738 sqft
AED 6,430,0002,348 AED/sqft
4 Nov 2026
Apartment2 bedsReady1,390 sqft
AED 2,700,0001,942 AED/sqft
4 Nov 2026
Apartment2 bedsReady1,281 sqft
AED 2,400,0001,874 AED/sqft
3 Nov 2026
Apartment1 bedReady899 sqft
AED 1,860,0002,069 AED/sqft
3 Nov 2026
Sobha Hartland Greens - Phase III
ApartmentStudioReady964 sqft
Sobha Hartland Greens - Phase III - 2AED 729,792757 AED/sqft unusually low AED/sq ft for its project
2 Nov 2026
Apartment2 bedsReady1,618 sqft
AED 2,860,0001,768 AED/sqft
2 Nov 2026
Apartment2 bedsReady1,481 sqft
AED 2,850,0001,924 AED/sqft
2 Nov 2026
Apartment2 bedsOff-plan1,283 sqft
Tower BAED 2,377,7141,853 AED/sqft
2 Nov 2026
Apartment2 bedsReady1,118 sqft
AED 2,260,0002,021 AED/sqft
Unusually low AED/sq ft for its project: under 50% of the 12-month median of the same home type there (or, with too few sales, in its area). The sale stays in every figure.
Asking prices against sales
- Property portal asking prices4.8%above registered sale pricesMedian gap across 6 segments
Property portal asking prices are compared with registered sales per segment (same market, property type and bedrooms), only where there are at least 10 listings and 10 sales. No individual listing is shown.
Questions about Sobha Hartland
What is the price per sq ft in Sobha Hartland?
In the 12 months to 4 November 2026, the median registered sale price was 2,024 AED/sqft for ready homes and 2,026 AED/sqft off-plan. The two medians mix different home types.
How did prices and sales in Sobha Hartland change over the last year?
In the 12 months to 4 November 2026, the ready price per sq ft of the same home types fell 2.1% (Dubai +6.4%), and registered sales fell 14.4% to 1,158. In the last 3 months, the ready price per sq ft of the same home types stood 8.1% below the same months a year before (Dubai +1.6%).
What is the rental yield in Sobha Hartland?
Net yield, Apartment · 1 bed: 5.4% after the area’s median service charge (AED 17.47 per sq ft a year, 2026, budgets of 15 developments). Gross yield: 6.3%. Rents and prices from the 12 months to 4 November 2026. Net yield takes the service charge off the rent. It is still before vacancy, maintenance, agency and DLD fees and mortgage costs, and an owners’ association budget is not any one owner’s bill.
What are the service charges in Sobha Hartland?
The area’s median service charge in 2026 is AED 17.47 per sq ft a year, across the owners’ association budgets of 15 developments. Apartment buildings’ budgets; villa and townhouse budgets are left out.
How many homes are under construction or planned in Sobha Hartland?
As of 4 November 2026, the DLD project register lists 1,696 homes under construction or planned in Sobha Hartland, 0 of them in projects with a DLD end date in the next 24 months. An end date is the date in the DLD register, not a handover forecast.
Where do these figures come from?
From Dubai Land Department open data, published on Dubai Data, to 4 November 2026: registered sales, new rent contracts and the project register. They are registered sales, not a valuation, and not investment advice.
To buy or rent
Looking to buy or rent in Sobha Hartland?
Leave your details and partner agents who work in Sobha Hartland can send you homes for sale or rent that match what you are looking for.